The Cumberlands Patriots Volleyball team is on an historic run but is it smoke and mirrors? Is it just a weak schedule? I break down the stats to see how UC (27-0) stacks up to the 9 schools above them in the rankings. Yes, our schedule has been weak, with our strength of schedule ranking 109th in the NAIA. However the stats will show that is not the reason for success this season.
1️⃣ Defensive Dominance: Shutting Down the Nation
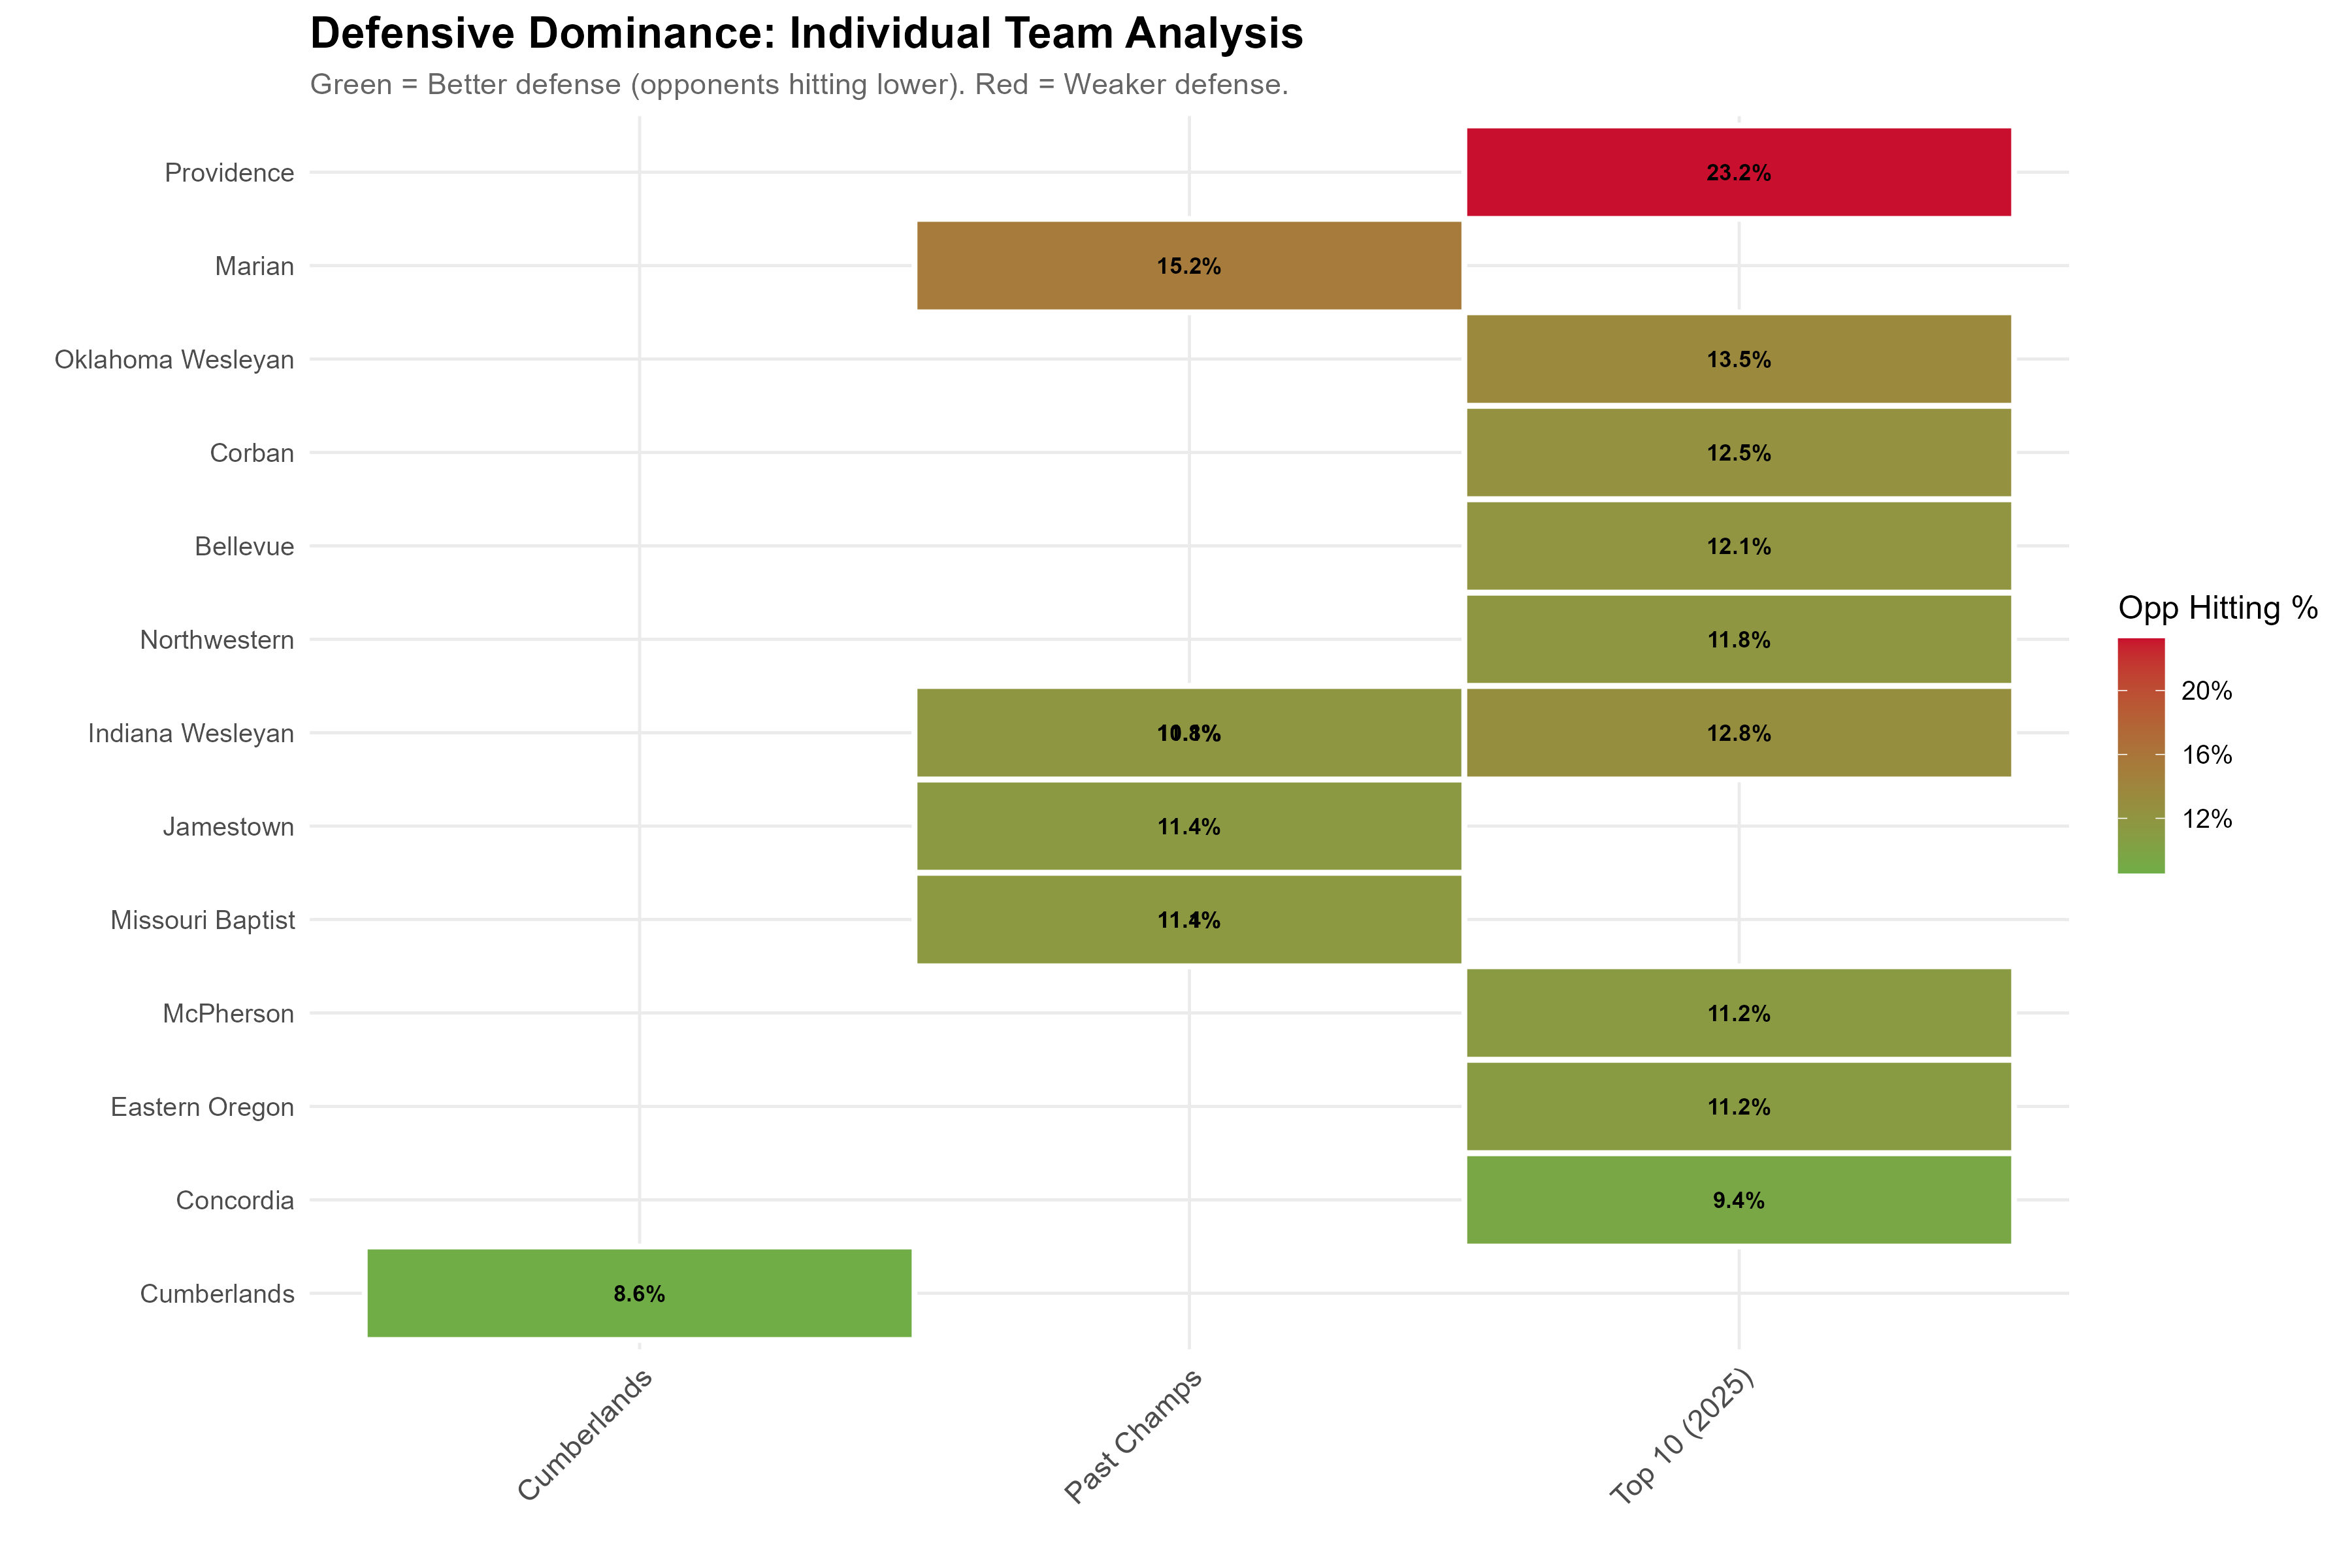 Green = Better defense (opponents hitting lower).
Among the nation’s top programs, Cumberlands stand alone defensively.
Opponents hit just 8.6 % against them — nearly 4 percentage points lower than the average top‑10 team, and even better than most past champions.
This chart paints a clear picture: while other elite programs hover around 12–13 %, Cumberlands’ defense is historically stifling.
Opponents are simply unable to find kills.
2️⃣ The Complete DNA Profile: Total Team Balance

Every key metric is normalized to show relative dominance.
🔹 Cumberlands (blue): Elite in every category.
🔹 Past champions (red): Strong overall, but not complete.
🔹 Current top‑10 (green): Trailing across most fronts.
This chart shatters any notion of Cumberlands being one‑dimensional.
Their DNA shows offensive efficiency, serving power, defensive depth, and consistency — the full package that historically defines champions.
3️⃣ The Efficiency Matrix: Offense vs Defense

In this quadrant, teams strive for the bottom‑right corner (high offense, low opponent efficiency).
Cumberlands occupies that exact space — the rare mix of offensive explosiveness and defensive suffocation — clearly isolated from their peers.
They own the game’s two most decisive levers at once.
4️⃣ Hitting Efficiency: Deviation from Average
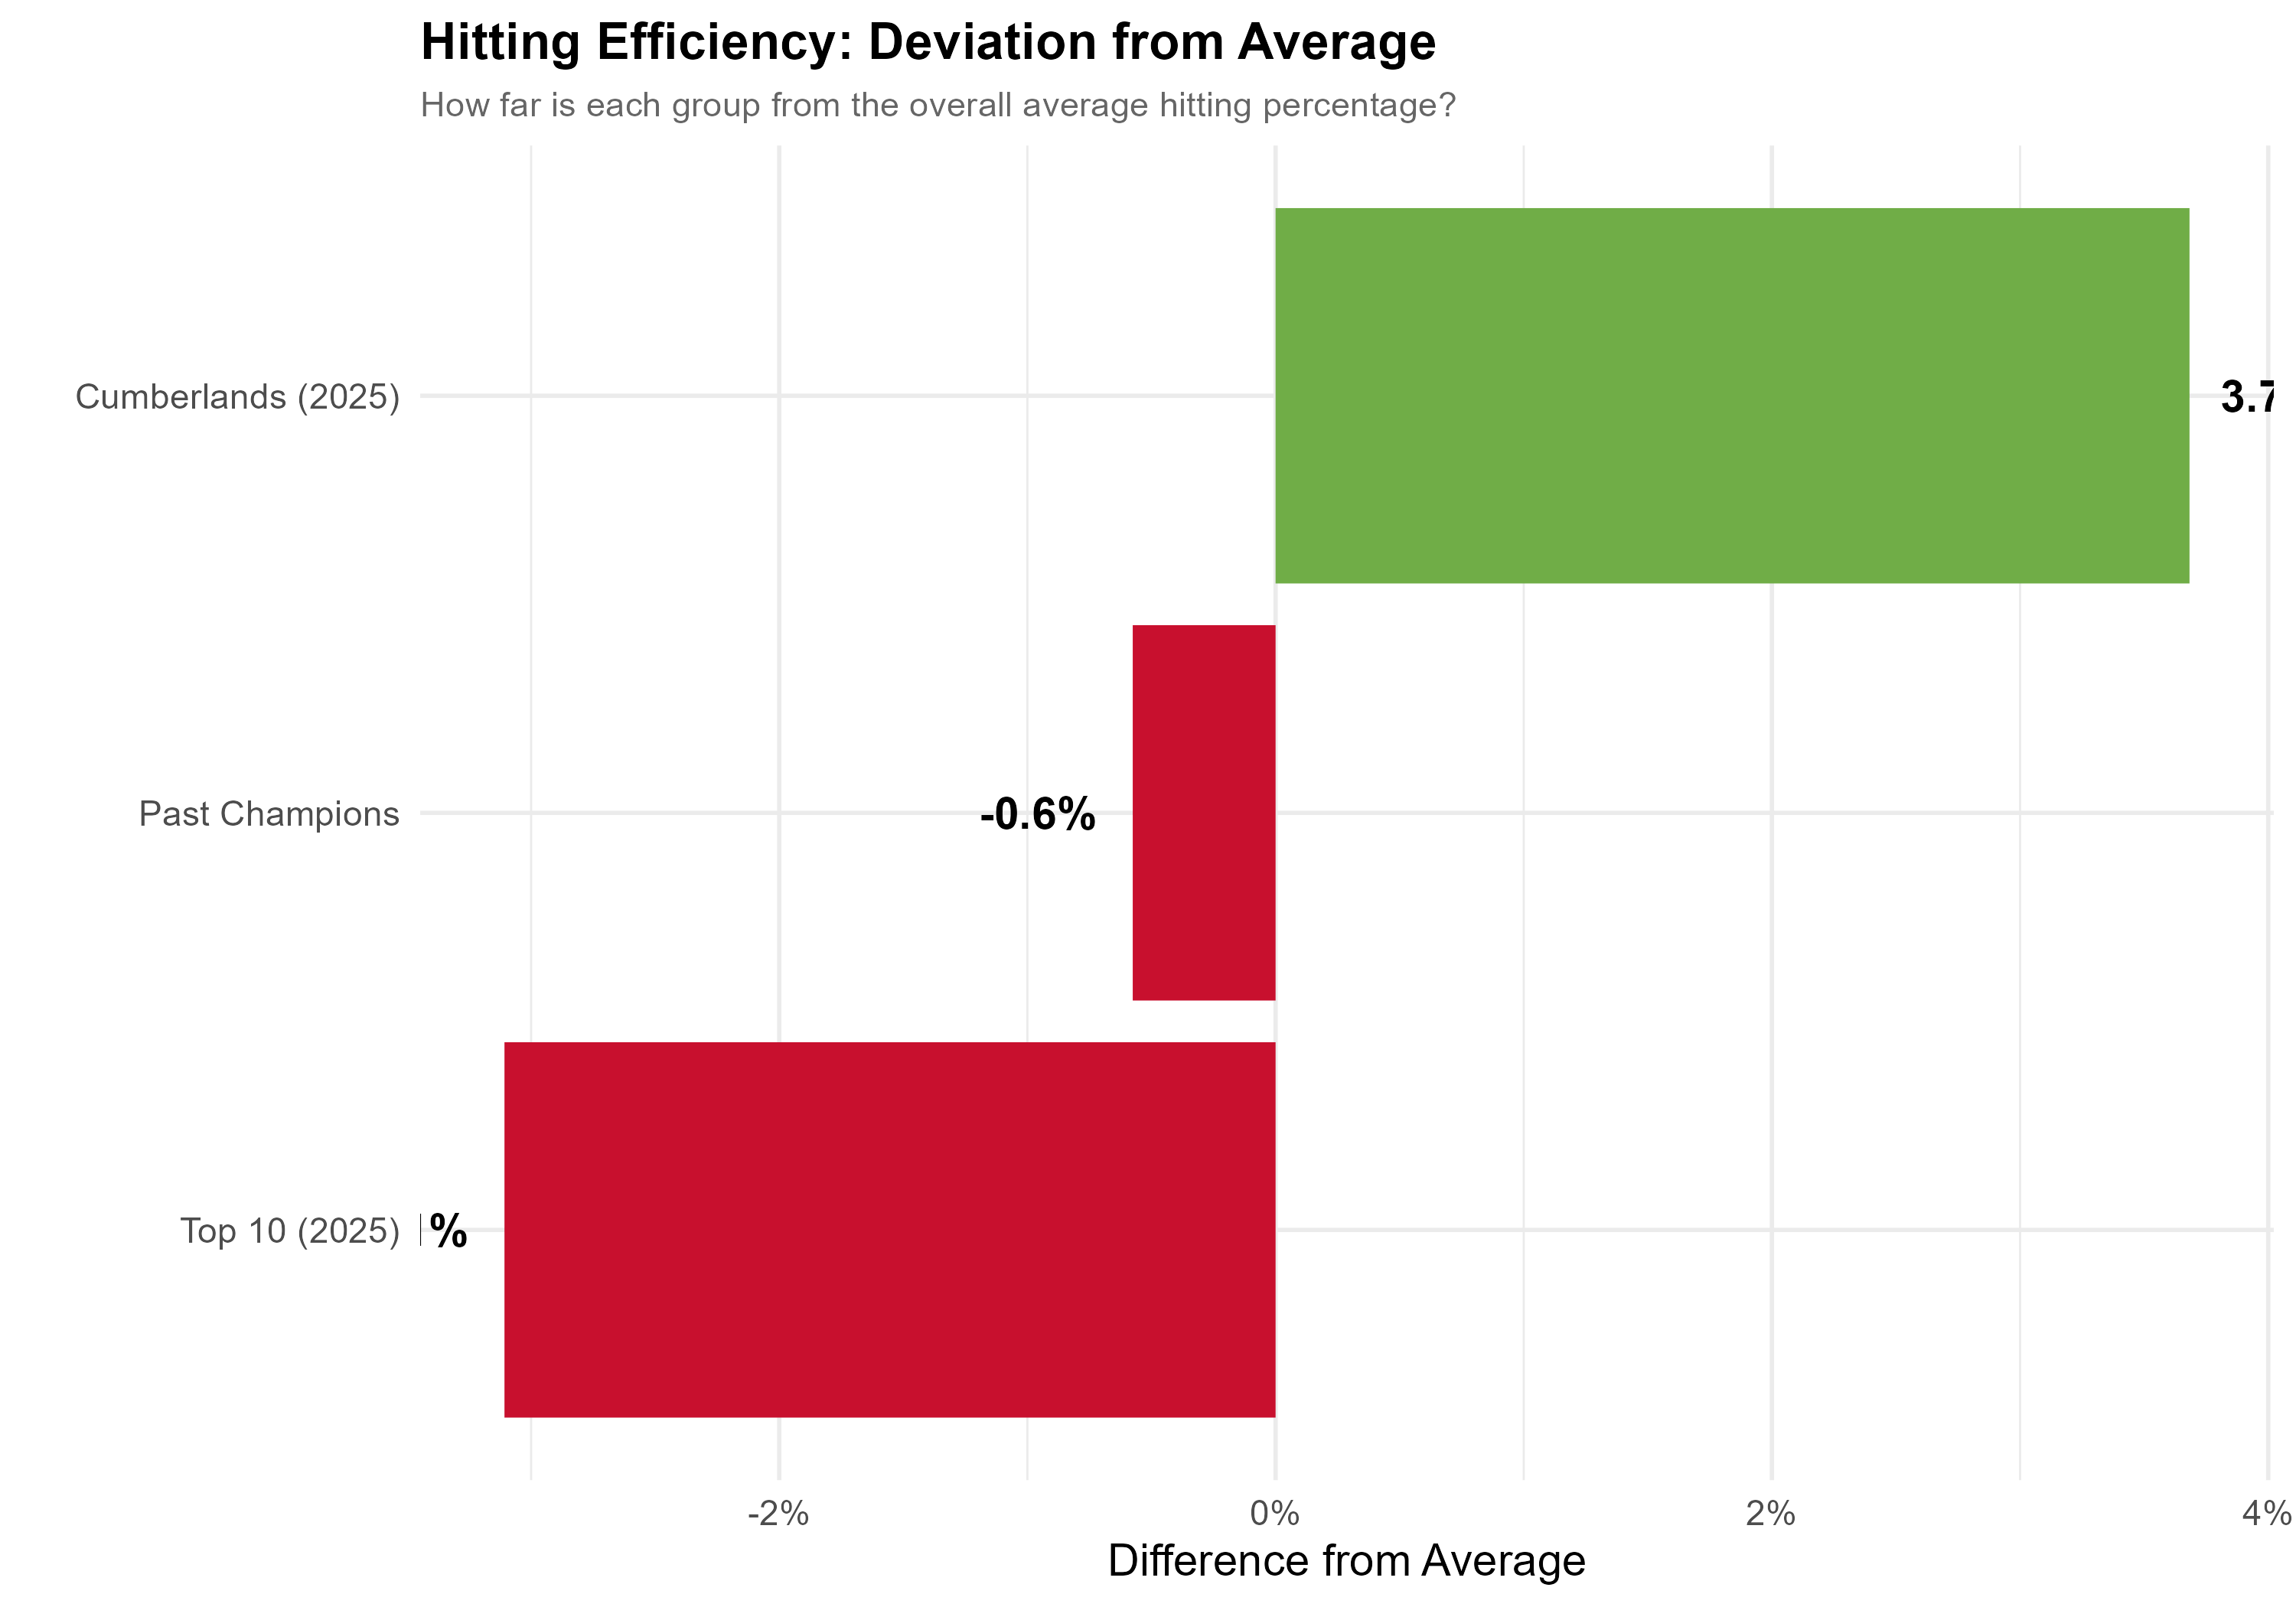
This snapshot tells the story numerically:
- Cumberlands: + 3.7 % higher than average
- Past Champions: − 0.6 % below average
- 2025 Top 10: About − 2 % below average
It confirms Cumberlands’ offense isn’t merely “good” — it’s redefining efficiency standards within national competition.
5️⃣ Offensive and Defensive Presence: Kills vs Blocks
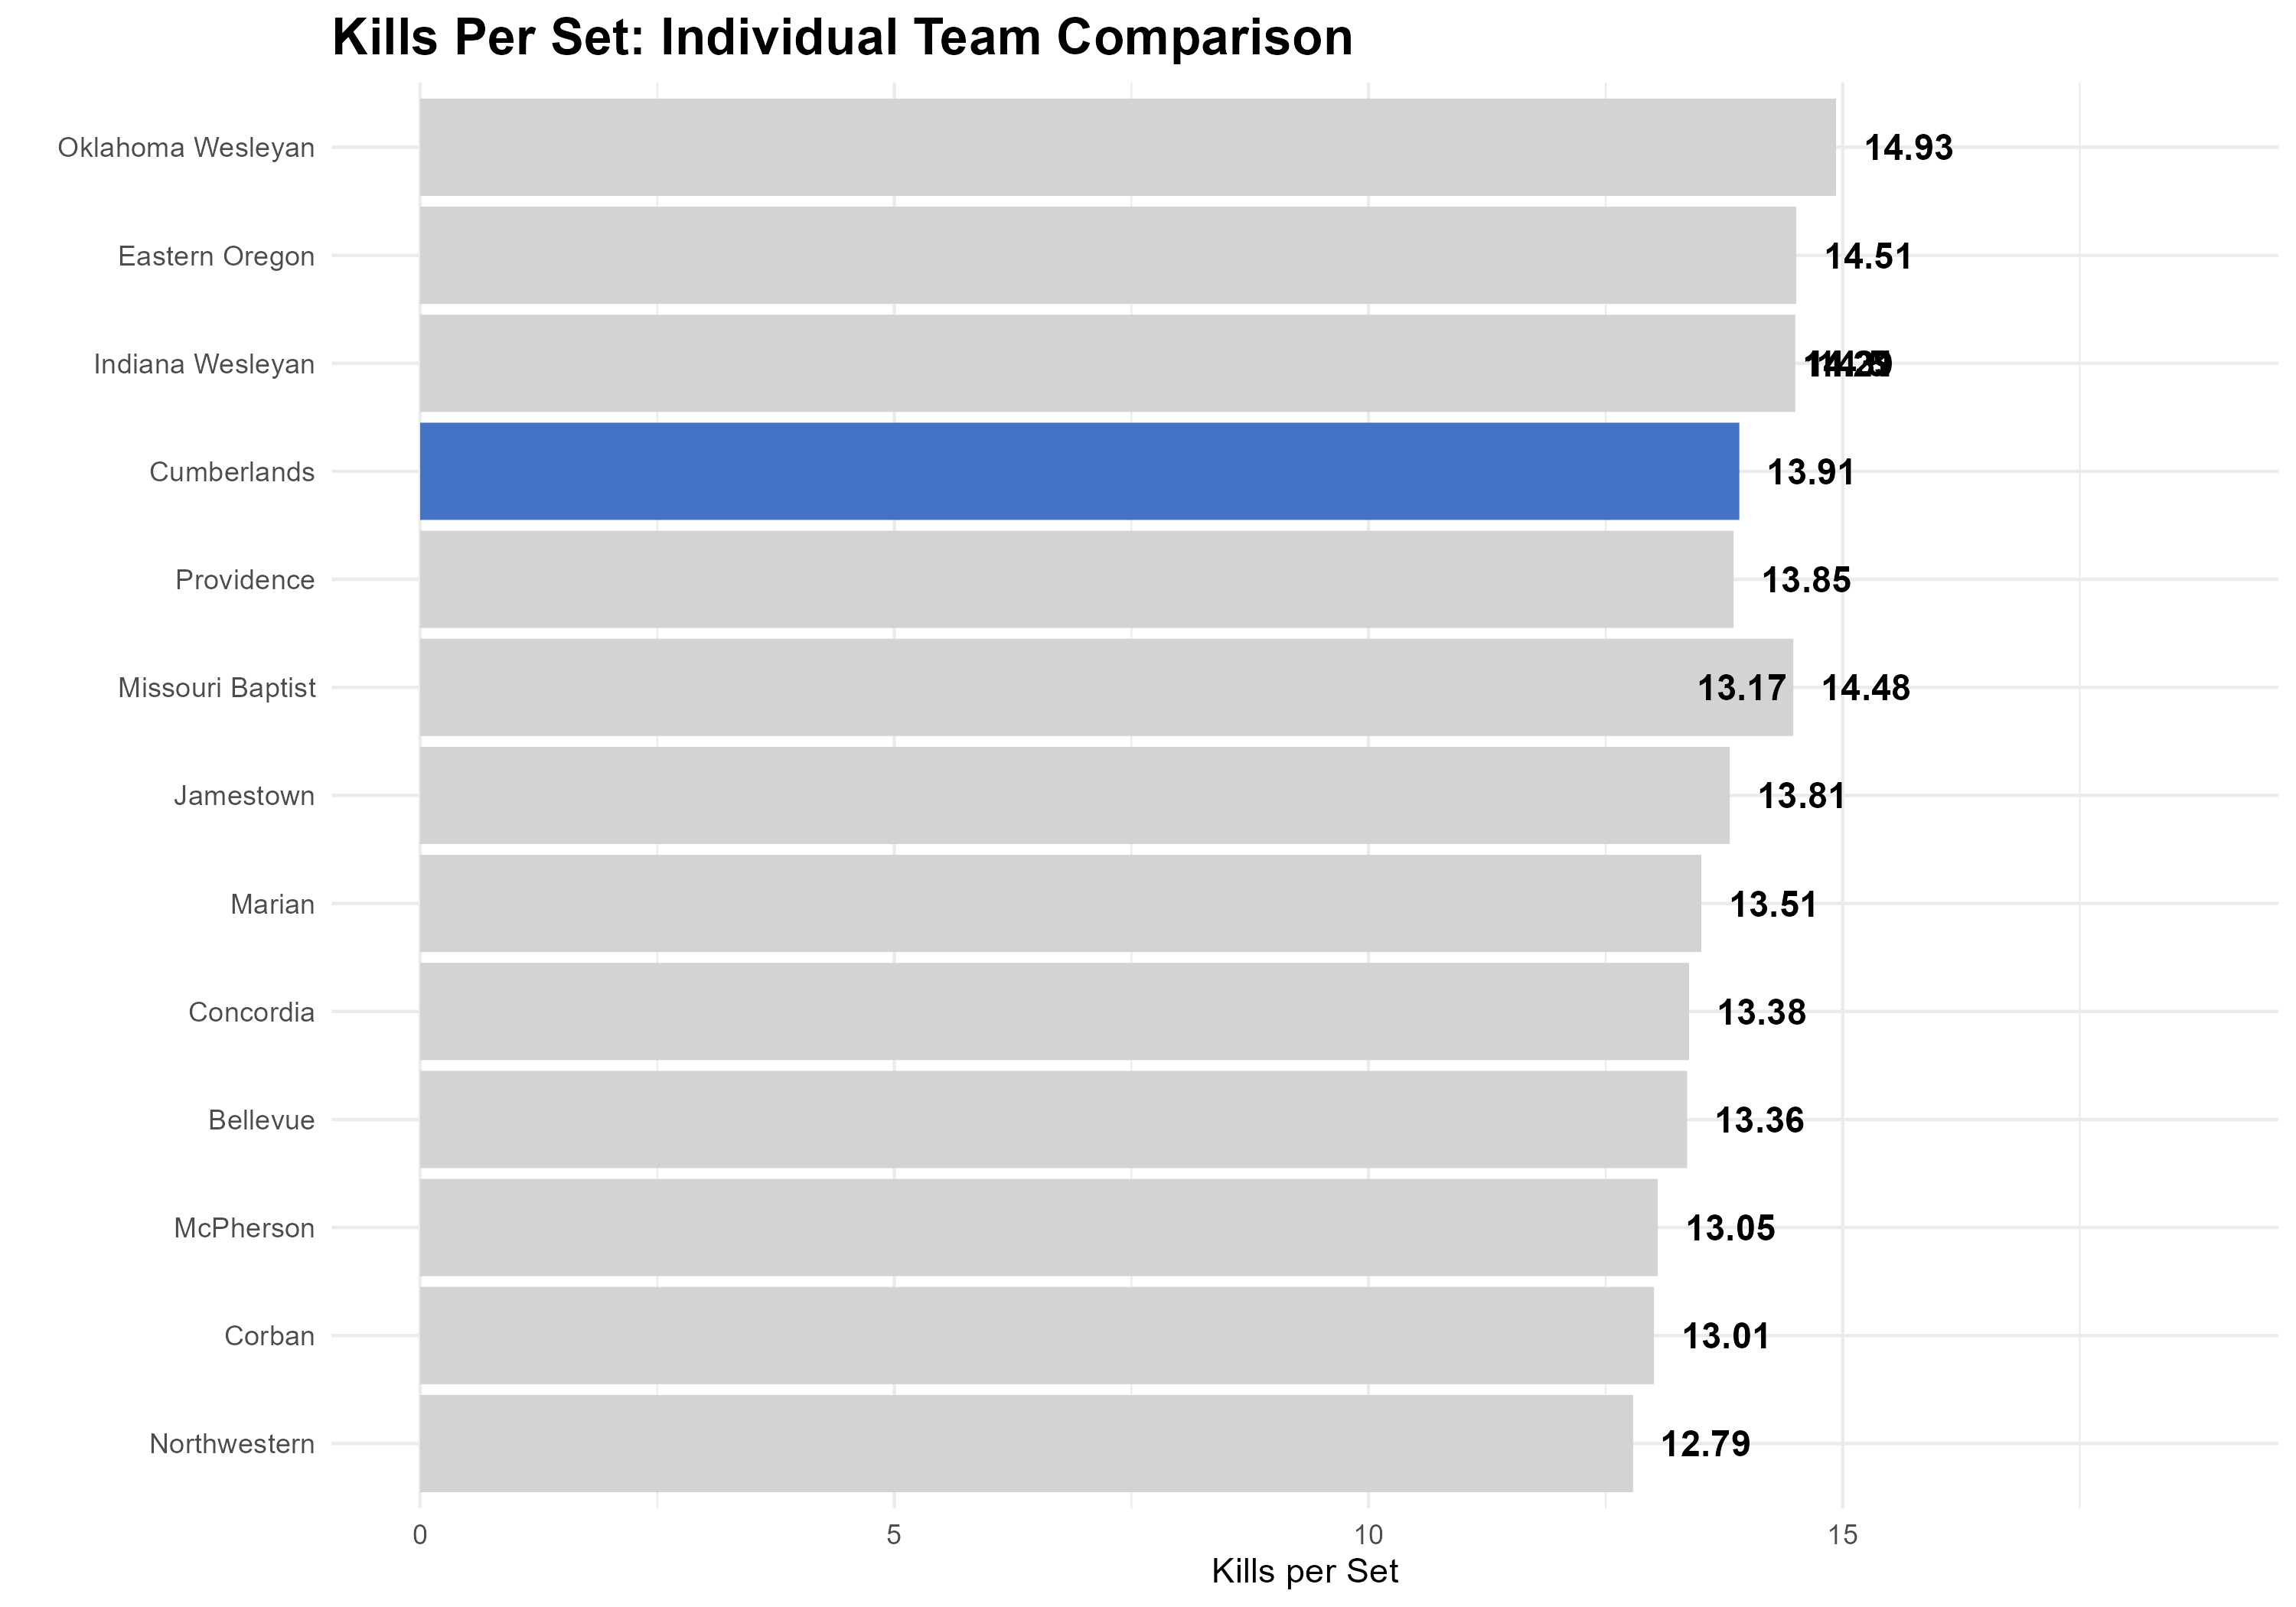
Plotting kills per set (offense) against blocks per set (defense) shows all‑around presence.
Cumberlands (red marker) sits comfortably among the best:
top‑tier attack output without sacrificing blocking performance.
Their system supports excellence on both sides of the net, adding to the depth of their dominance.
6️⃣ Dual Dominance: The Secret Weapon
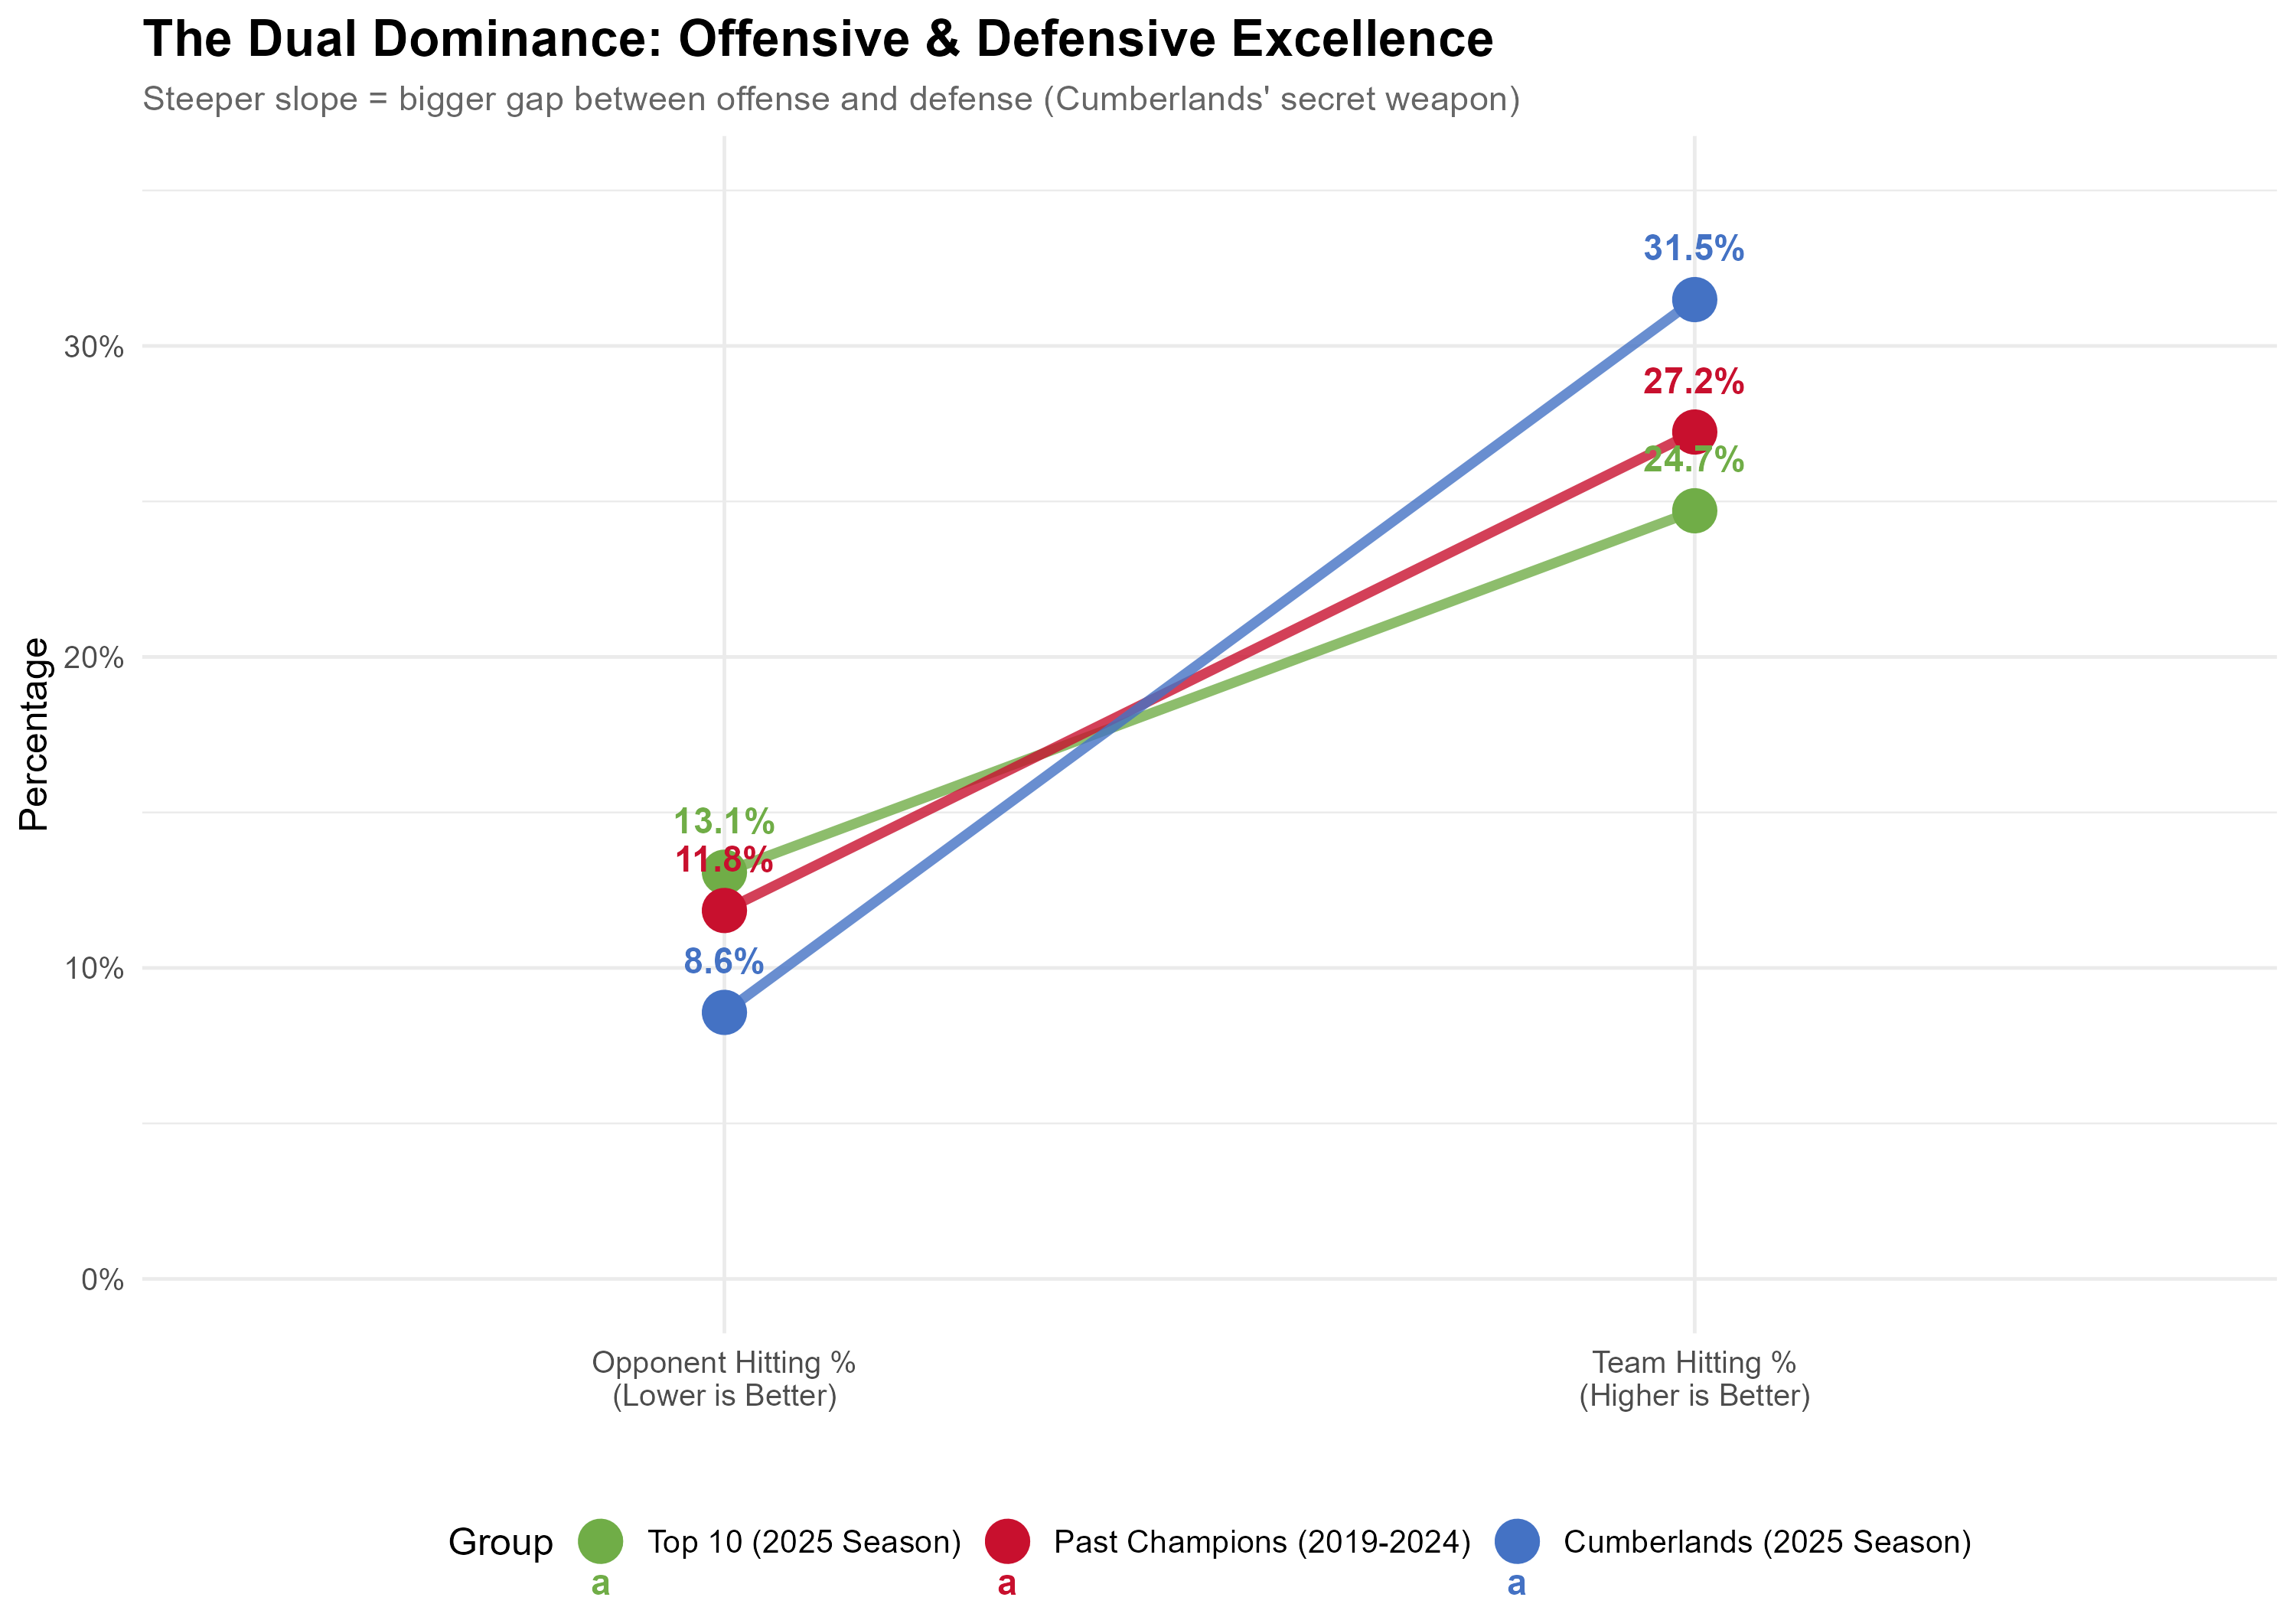
This “slope” chart captures Cumberlands’ 23‑point performance gap between offense and defense:
| Group | Opponent Hitting % | Team Hitting % | Gap |
|---|---|---|---|
| Top 10 (2025) | 13.1 % | 24.7 % | 11.6 pts |
| Past Champions | 11.8 % | 27.2 % | 15.4 pts |
| Cumberlands (2025) | 8.6 % | 31.5 % | 22.9 pts |
A steeper slope = greater separation = a formula for domination.
7️⃣ Offensive Efficiency: The Championship Hallmark
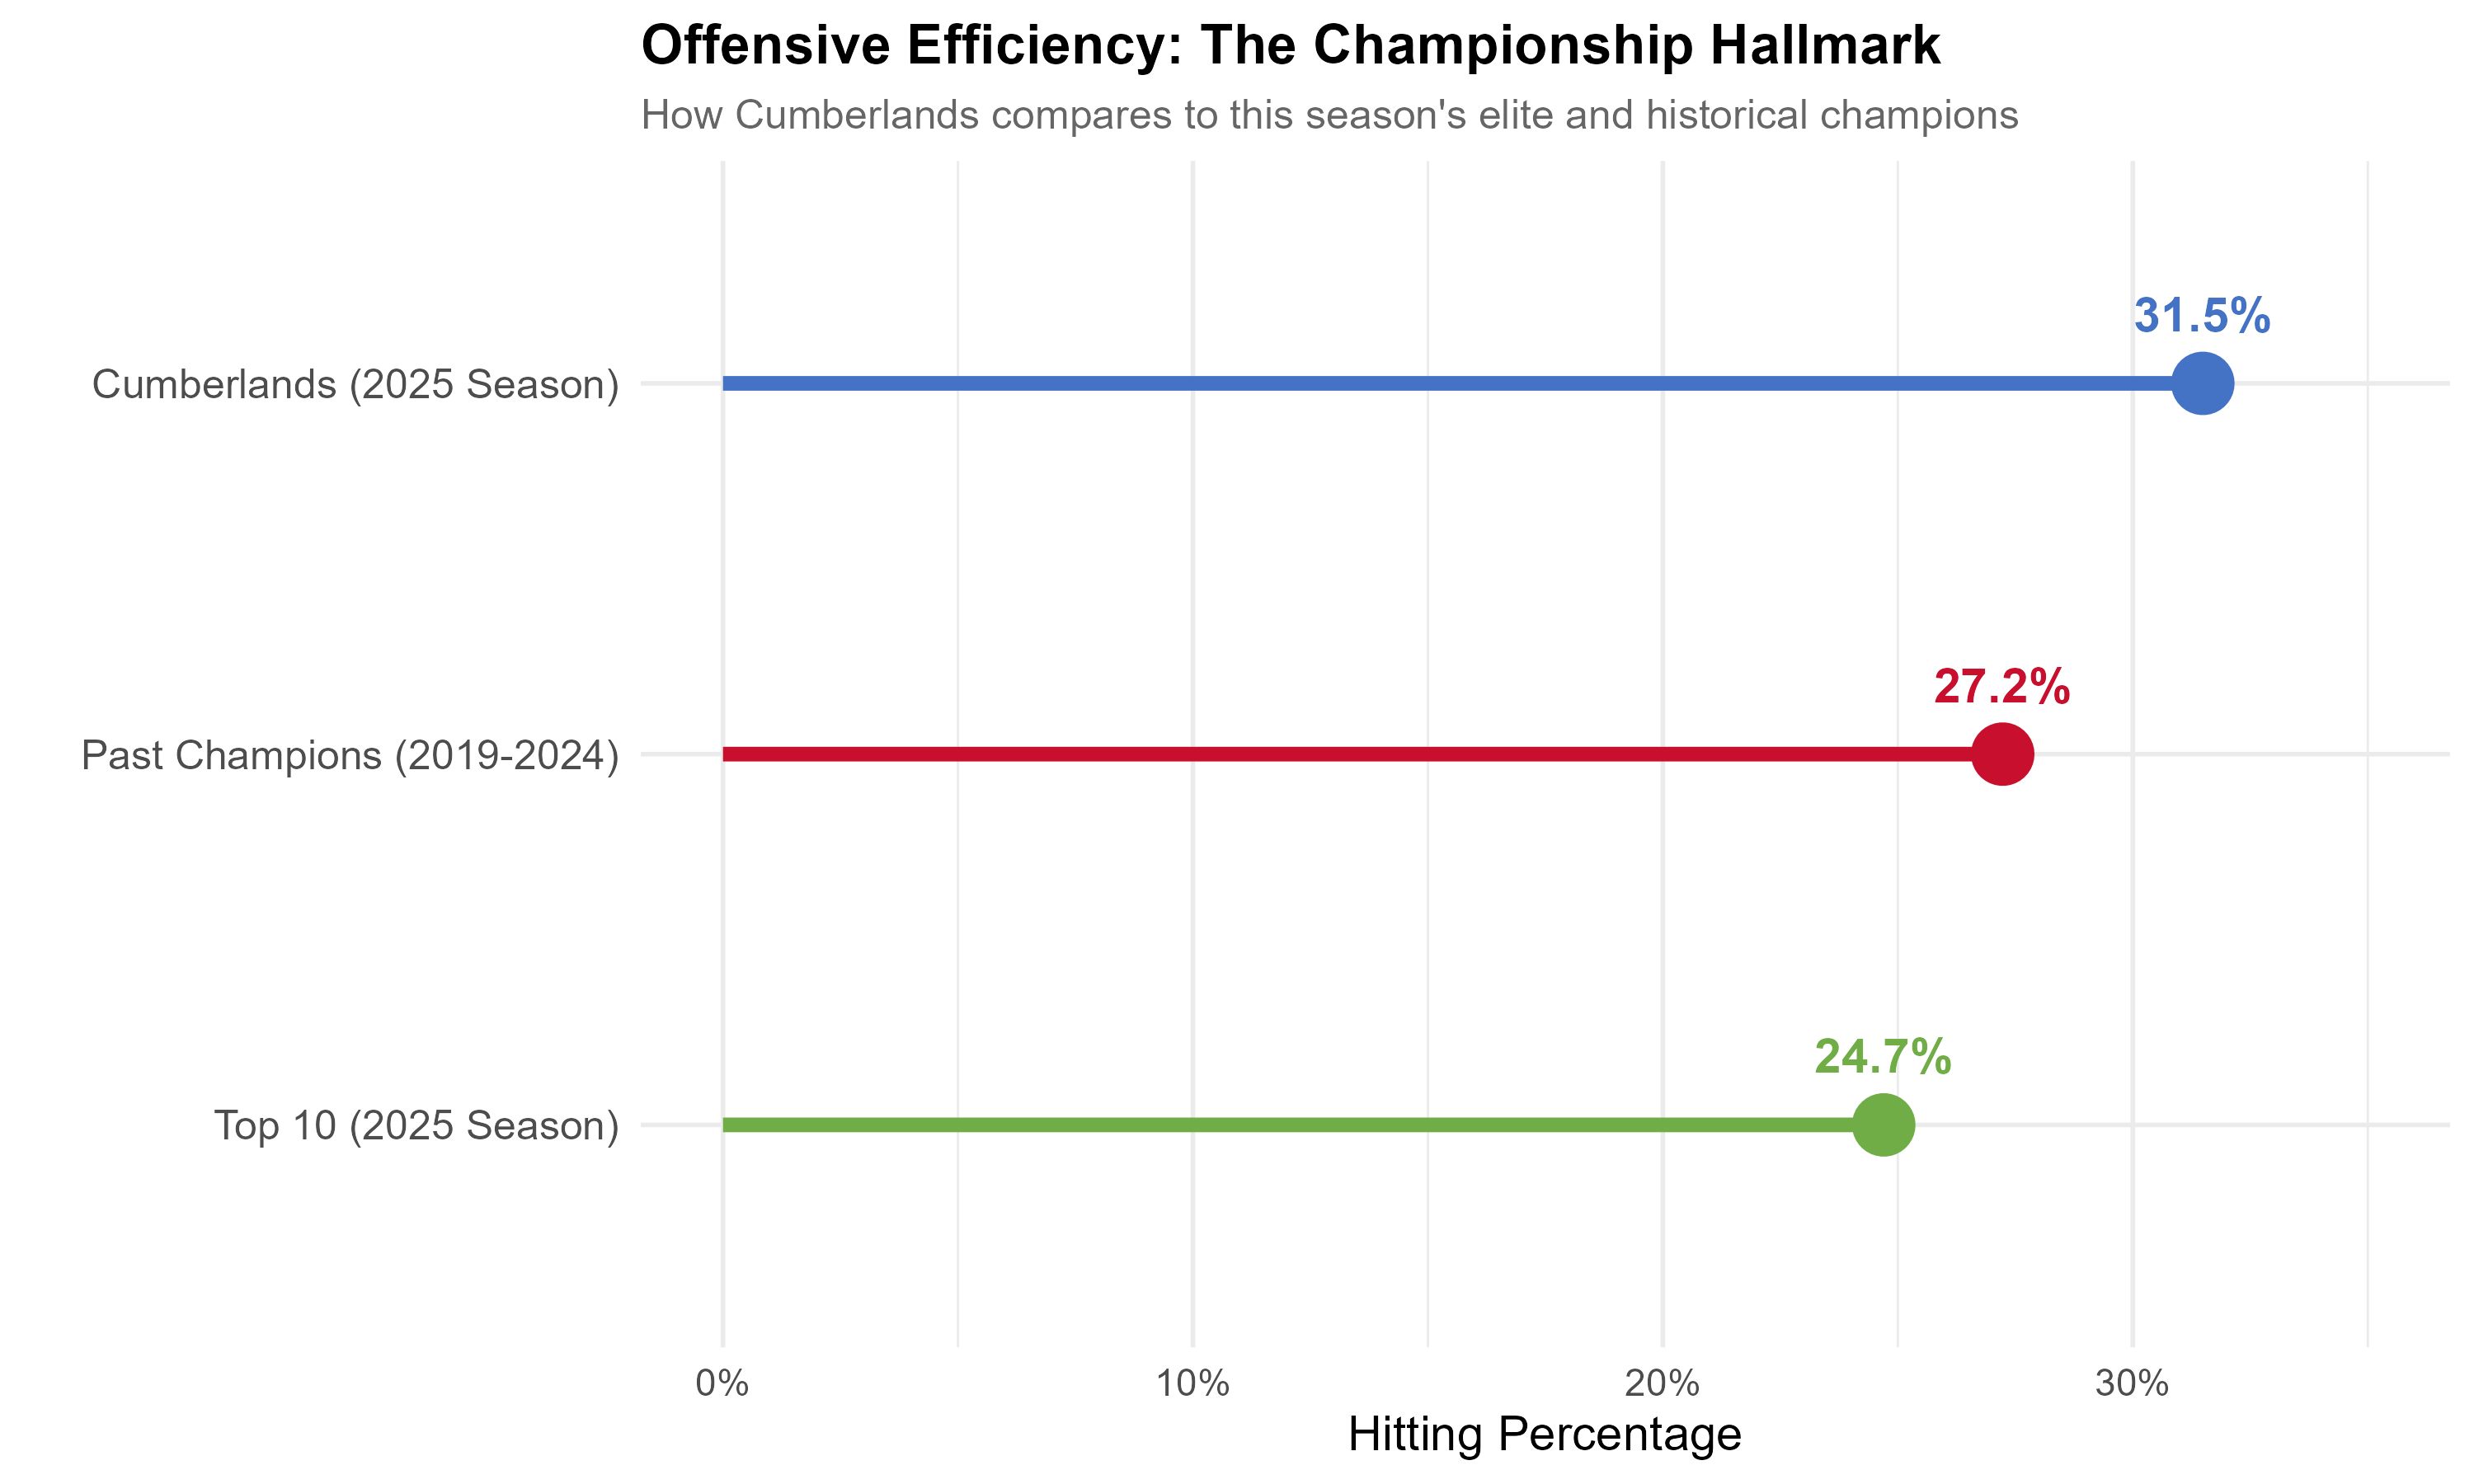
Hitting percentage is often the single best predictor of national titles.
- Cumberlands (31.5 %) outperform even past champions (27.2 %).
- The 2025 top 10 trail further at 24.7 %.
Cumberlands aren’t just elite — they’re setting a new offensive baseline.
8️⃣ Aggressive Serving: Pressure from the Line
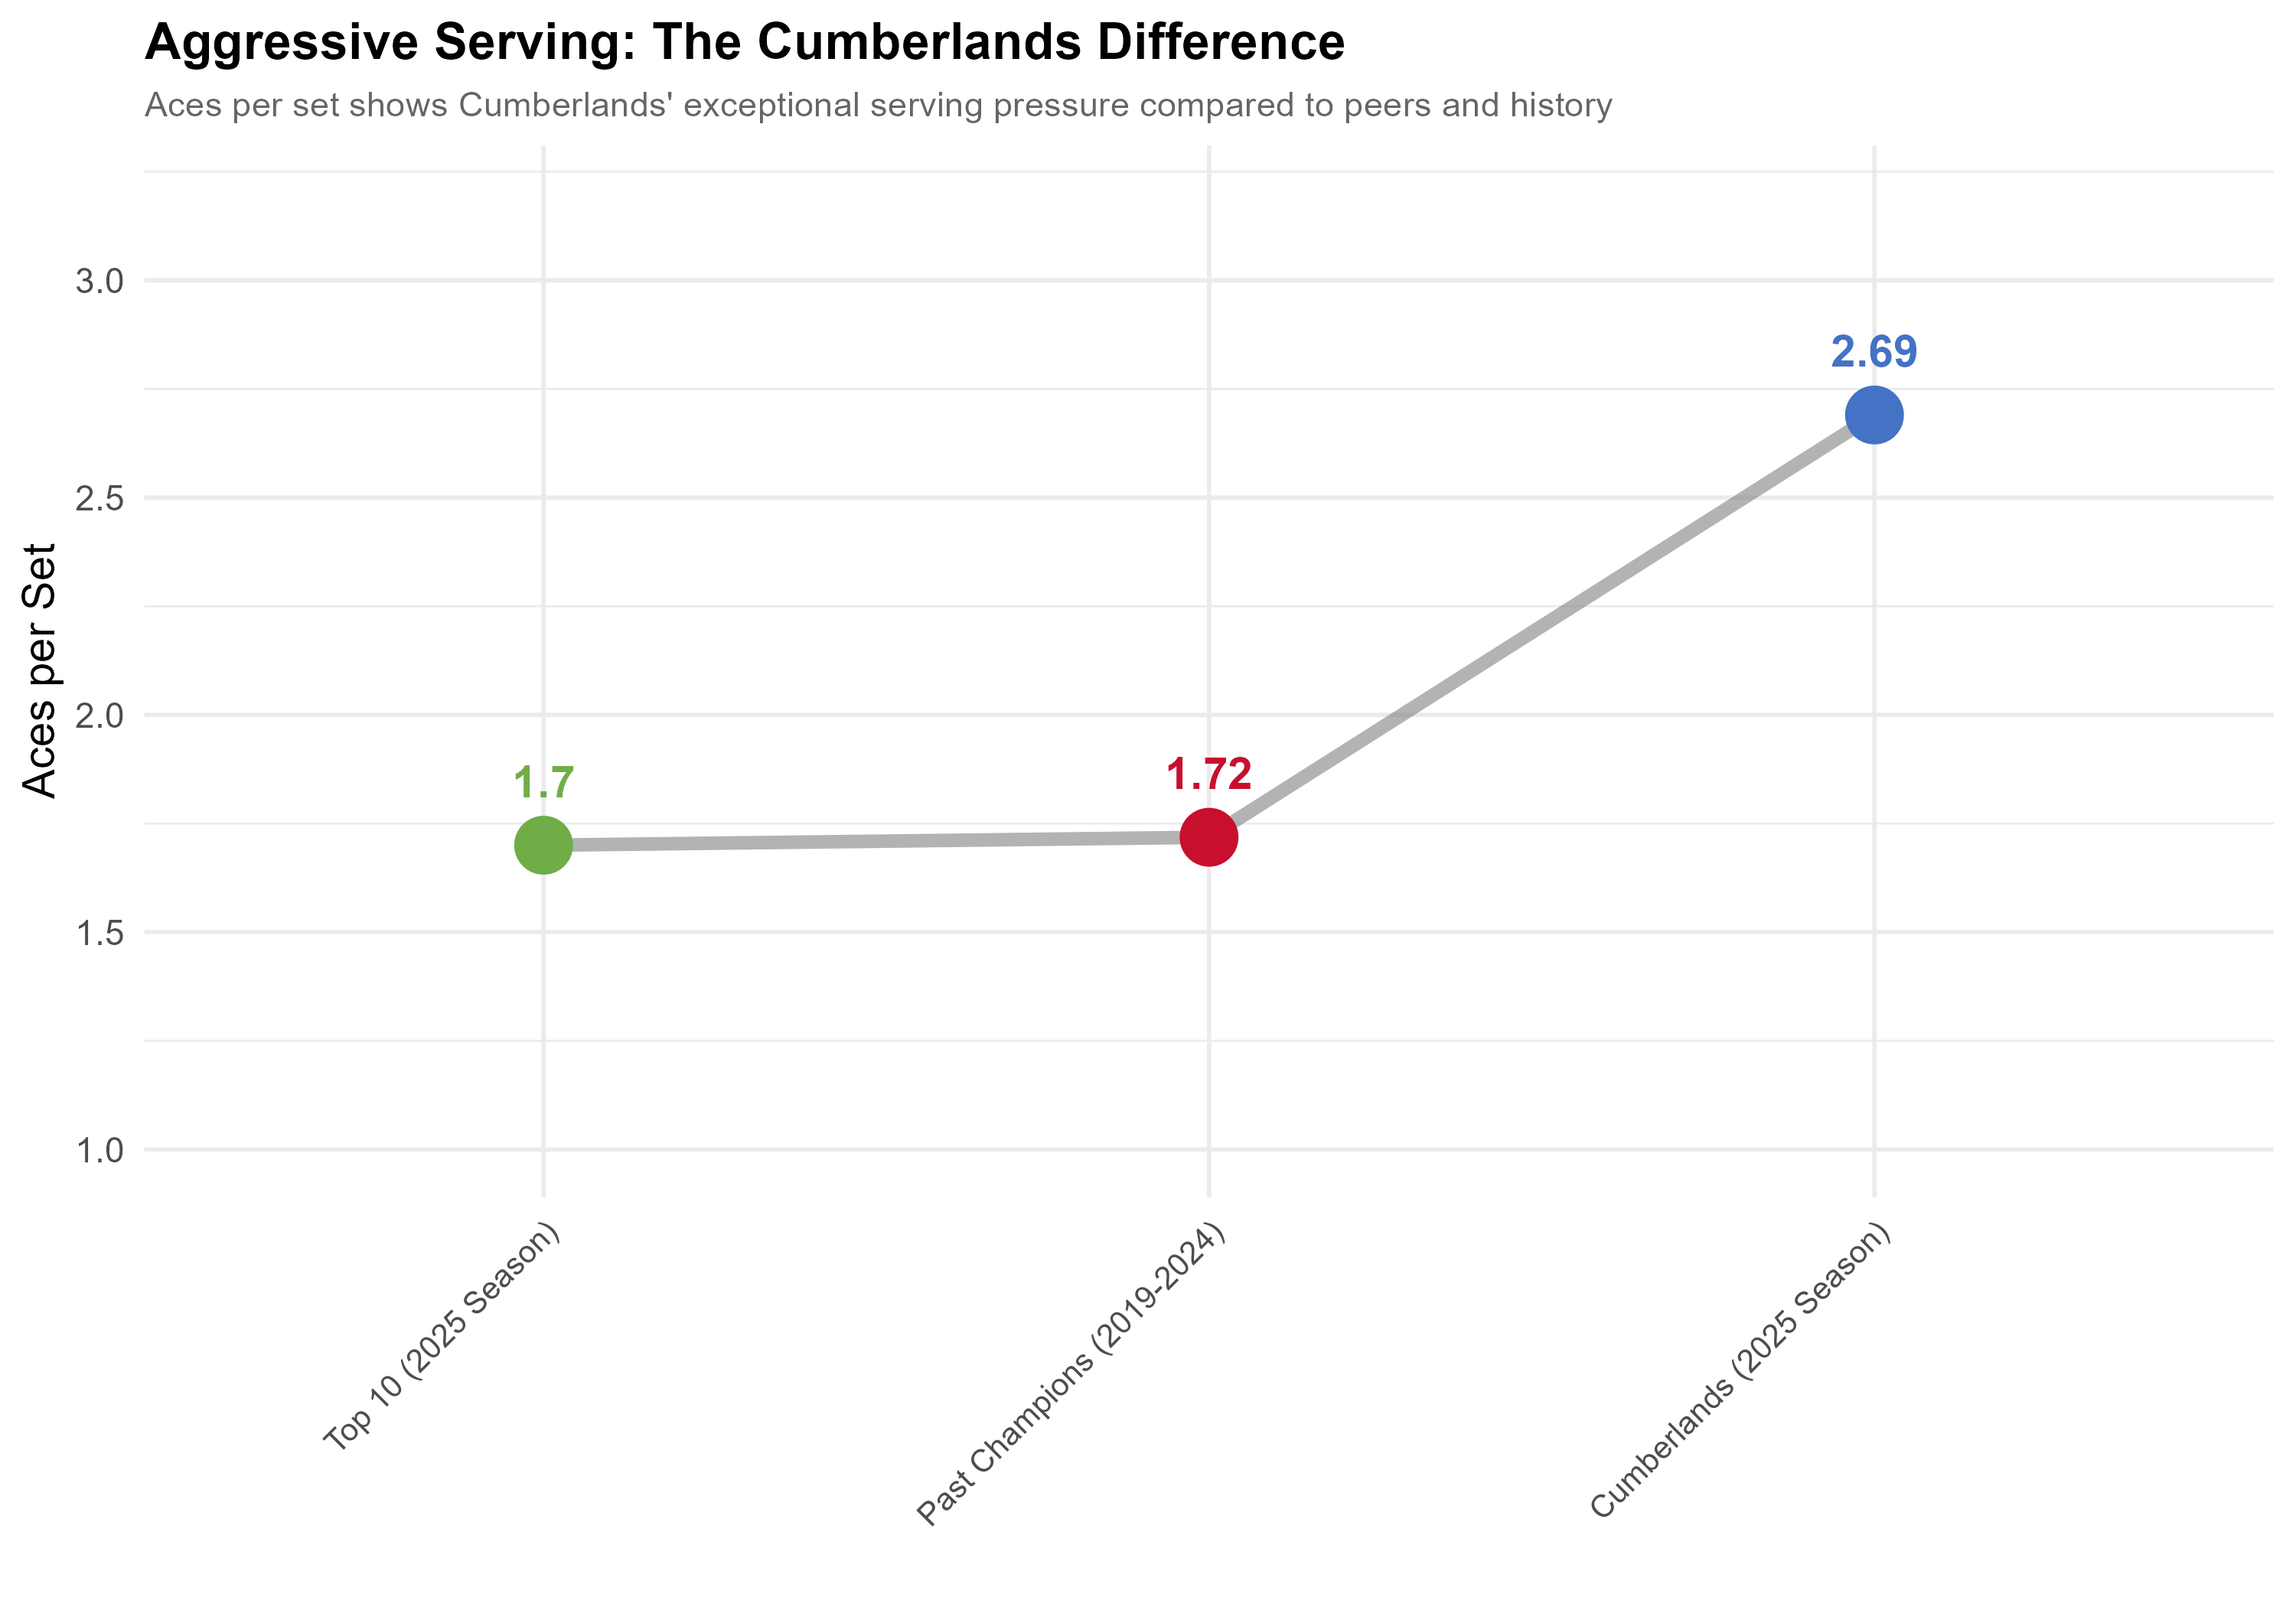
Aces per set spotlight the team’s aggression from the service line.
| Group | Aces / Set |
|---|---|
| Top 10 (2025) | 1.70 |
| Past Champions | 1.72 |
| Cumberlands (2025) | 2.69 |
Serving strength turns defense into offense — a signature of Cumberlands’ system that keeps opponents constantly under pressure.
🏁 The Final Word
Cumberlands’ 2025 season redefines two‑way dominance:
Historically low opponent efficiency + record‑setting offensive output = a new championship archetype.
Their metrics align more closely with long‑term dynasties than with current contenders.
From defense to serving to offensive precision, this version of Cumberlands doesn’t just outperform its peers — it establishes a new gold standard for what championship volleyball should look like.
📊 Plot Reference Index
| Plot | File | Description |
|---|---|---|
| 1 | images/plot1.png |
Defensive dominance by opponent hitting % |
| 2 | images/plot2.png |
“DNA profile” of normalized team stats |
| 3 | images/plot3.png |
Efficiency matrix – offense vs defense |
| 4 | images/plot4.png |
Hitting efficiency deviation from average |
| 5 | images/plot5.png |
Kills per set vs Blocks per set |
| 6 | images/plot6.png |
Dual dominance – offense and defense |
| 7 | images/plot7.png |
Offensive efficiency comparison |
| 8 | images/plot8.png |
Aggressive serving impact |
All visuals generated with ggplot2 in R using team performance data through the 2025 season.